Mapping Vegetation Cover in ESSEX CoUNTY Using NAIP Imagery and NDVI Analysis
Introduction
Urban greenery plays a crucial role in enhancing the quality of life in cities by improving air quality, reducing the heat island effect, and providing recreational spaces. Measuring and monitoring urban vegetation is vital for urban planners and environmentalists to make informed decisions. One of the effective ways to quantify vegetation cover is through the calculation of the Normalized Difference Vegetation Index (NDVI) using high-resolution aerial imagery. In this blog, we explore how to create a vegetation cover map for Essex County using NAIP (National Agriculture Imagery Program) imagery and NDVI analysis.
Data Collection and Preparation
The NAIP imagery provides high-resolution aerial photos of the United States. For this analysis, we focused on acquiring the NAIP imagery for Essex County during the summer months (June to September 2017) when vegetation is typically at its peak. The NAIP imagery consists of four bands Red, Green, Blue, and Near-Infrared (NIR).
To begin, we utilized Microsoft's Planetary Computer STAC API and Python programming to search and download the required NAIP tiles that intersect with the Essex County boundary. The geographical extent was defined using the city's shapefile, and the imagery was filtered to match our desired date range.
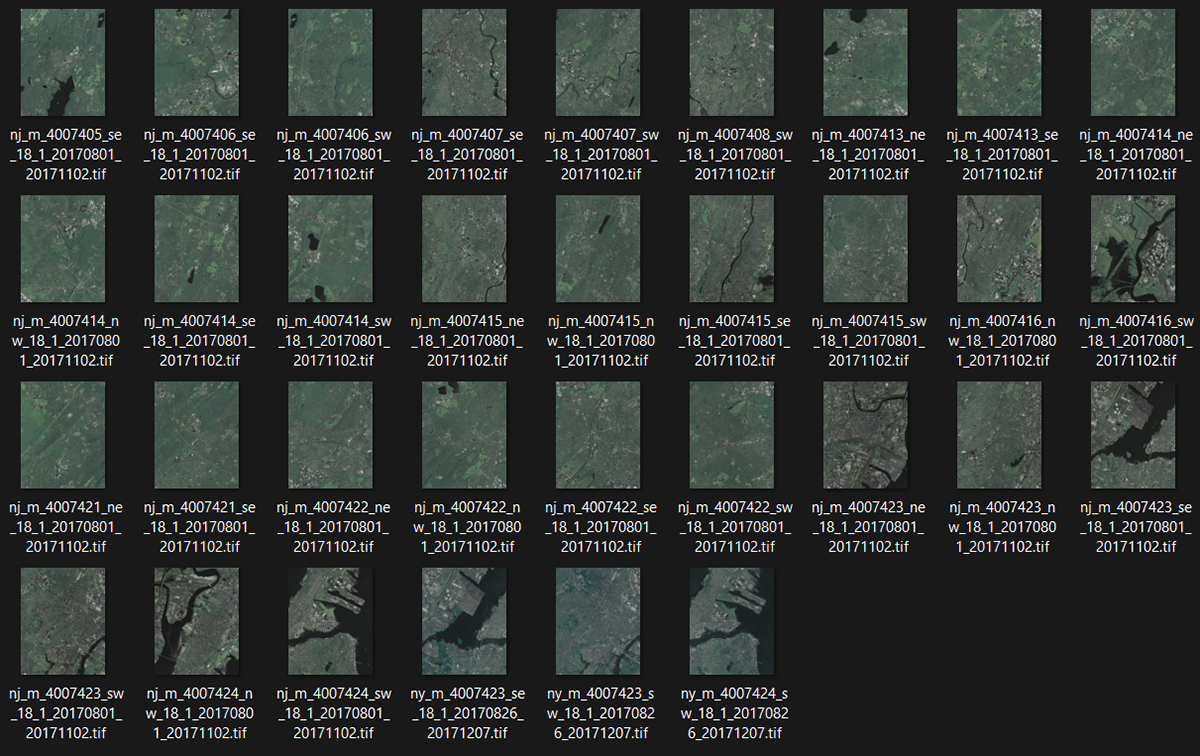
NAIP TILES OF ESSEX COUNTY
Processing NAIP Imagery
The NAIP imagery is composed of several tiles, each covering different parts of Essex County. The following steps were taken to process the imagery:
a) Mosaic the NAIP Tiles: Essex County is covered by multiple NAIP tiles. To analyze the entire county consistently, we merged these individual tiles into a seamless mosaic. This step allows for uniform NDVI calculations across the entire area of interest without boundary artifacts.
b) Clipping the Mosaic Image: Since the mosaiced image includes areas outside the Essex County boundary, we used the shapefile to clipping out the pixels that fall outside the County limits.
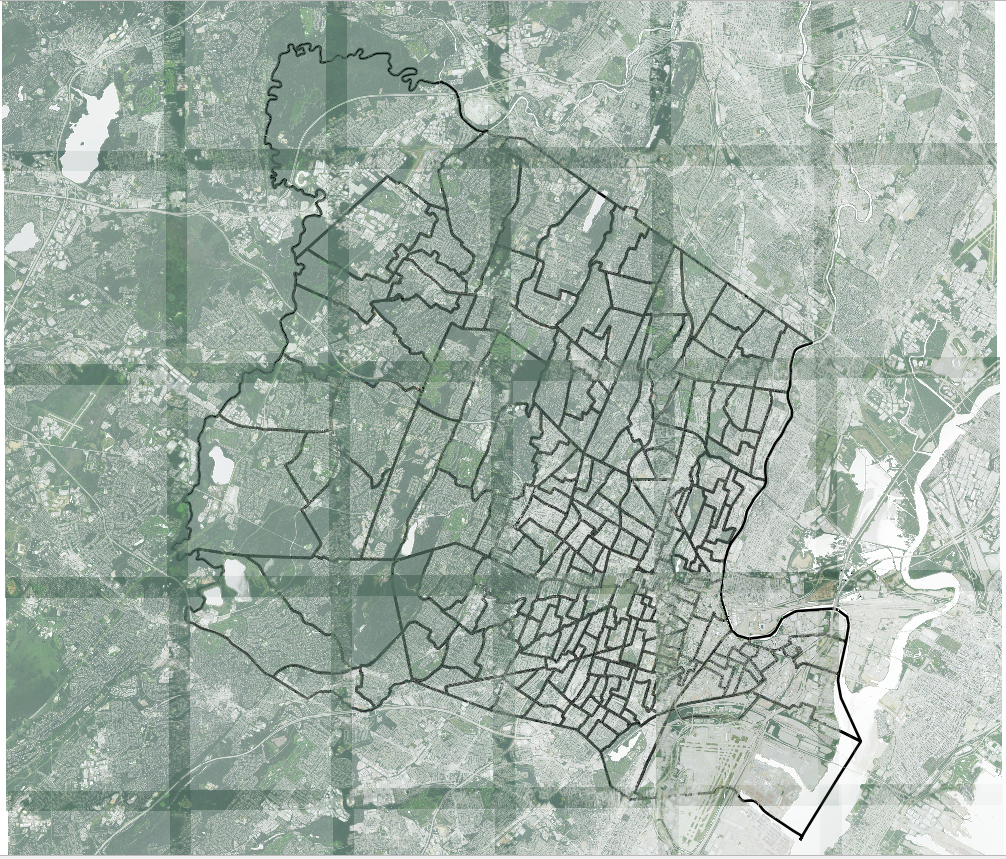
(a) NAIP TILES OVER SHAPEFILE
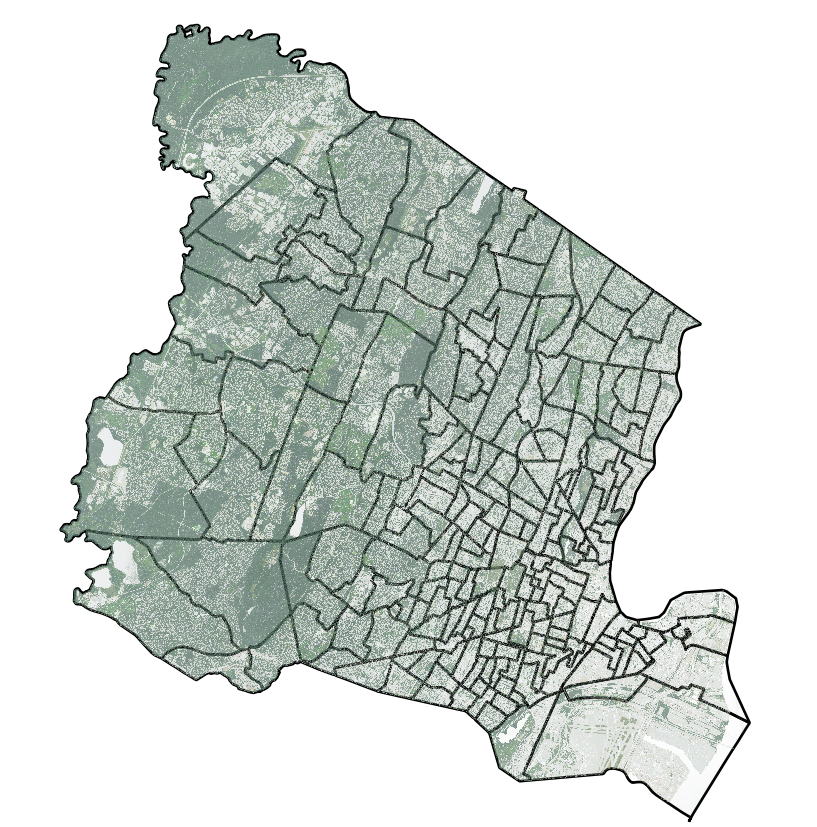
(b) NAIP TILES CLIPPED TO BOUNDARY OF SHAPEFILE
NDVI Calculation
The NDVI is a standardized vegetation index that quantifies vegetation by measuring the difference between near-infrared (which vegetation strongly reflects) and red light (which vegetation absorbs). The formula for NDVI is:
NDVI=(NIR-Red)/(NIR+Red)
where NIR represents the near-infrared band and Red represents the red band of the NAIP imagery. A higher NDVI value indicates more dense and healthy vegetation, while lower values suggest sparse or non-vegetated areas.
We computed NDVI for each pixel in the masked mosaiced image and then visualized the results using a color map. Areas with higher NDVI values are depicted in darker shades of green, representing more vegetation, whereas lighter shades represent less vegetation.
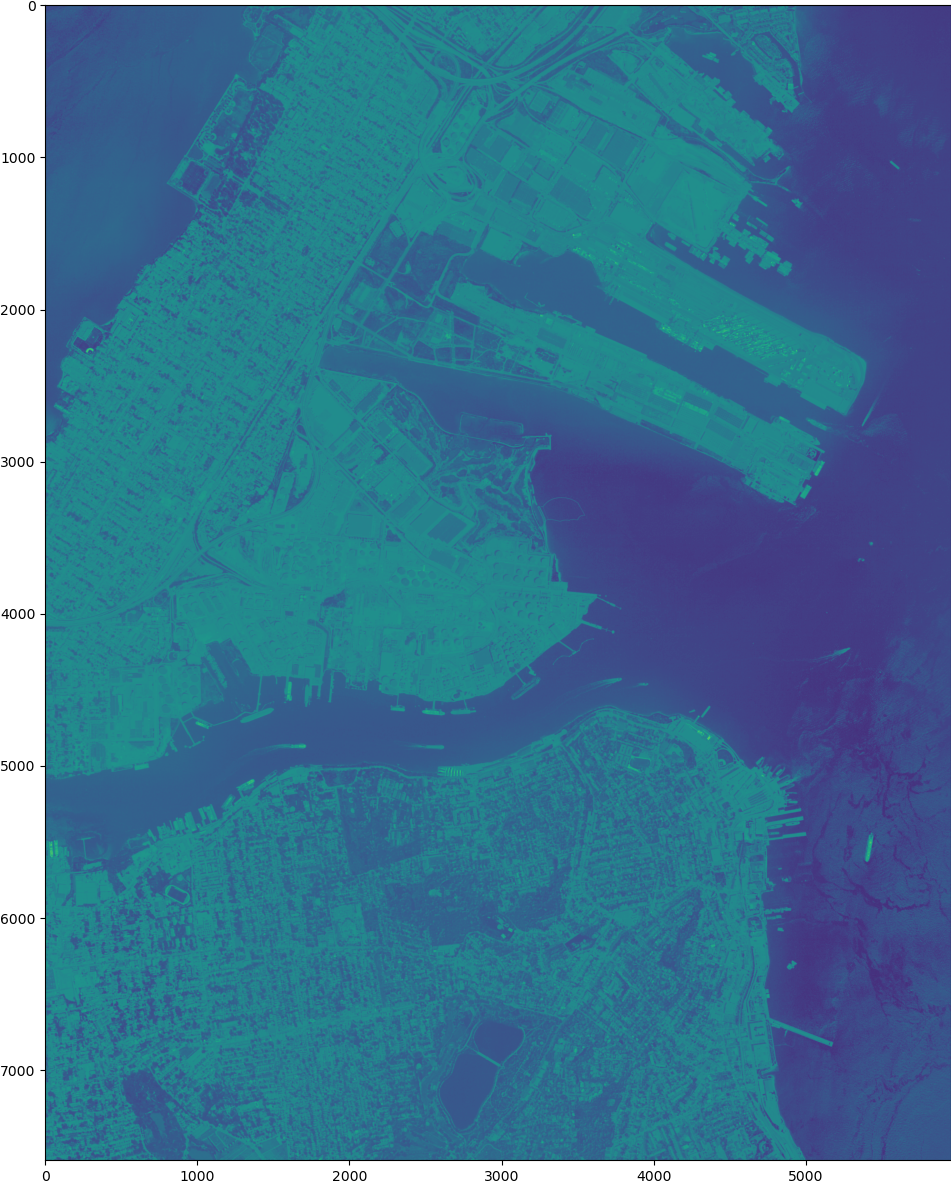
CALCULATING NDVI
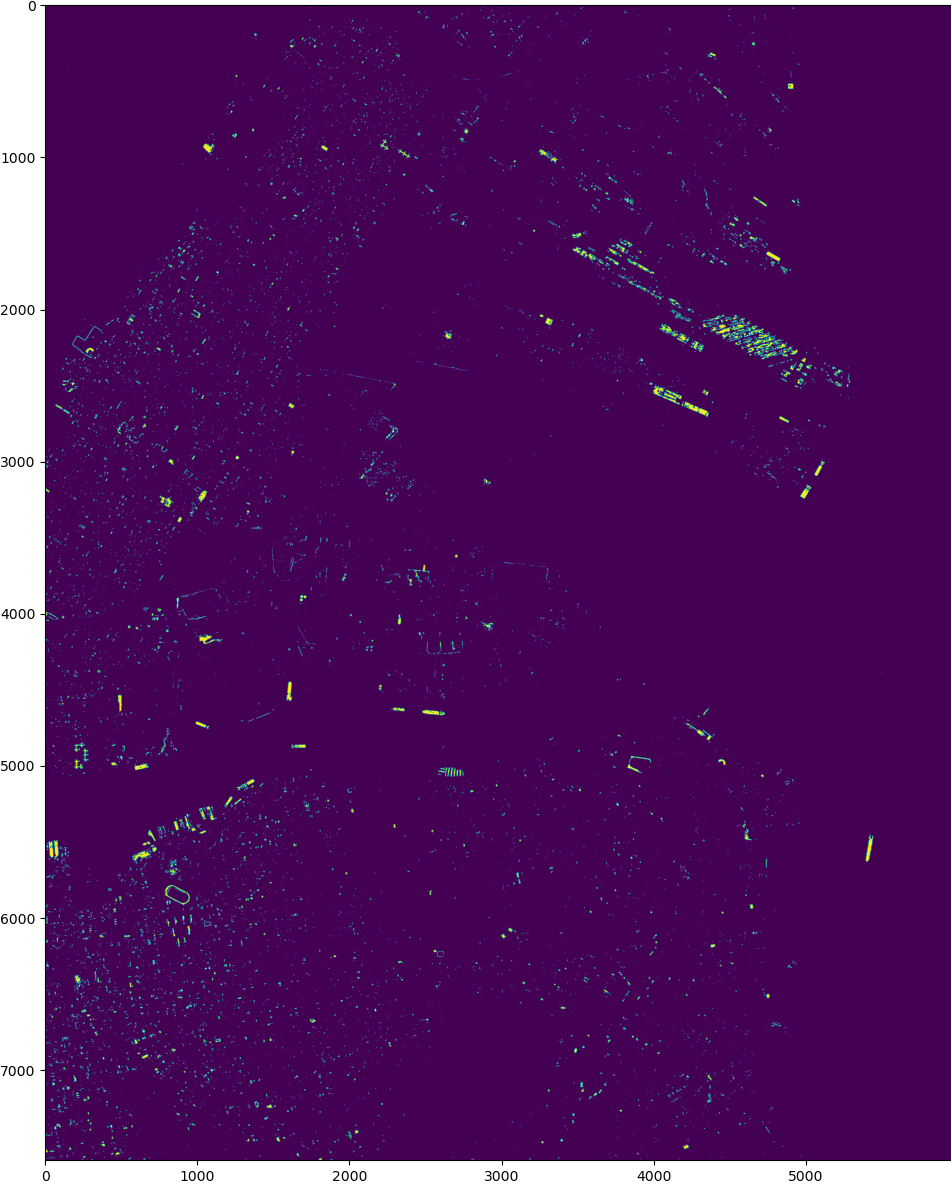
EXTRACTING VEGETATION
Results and Analysis
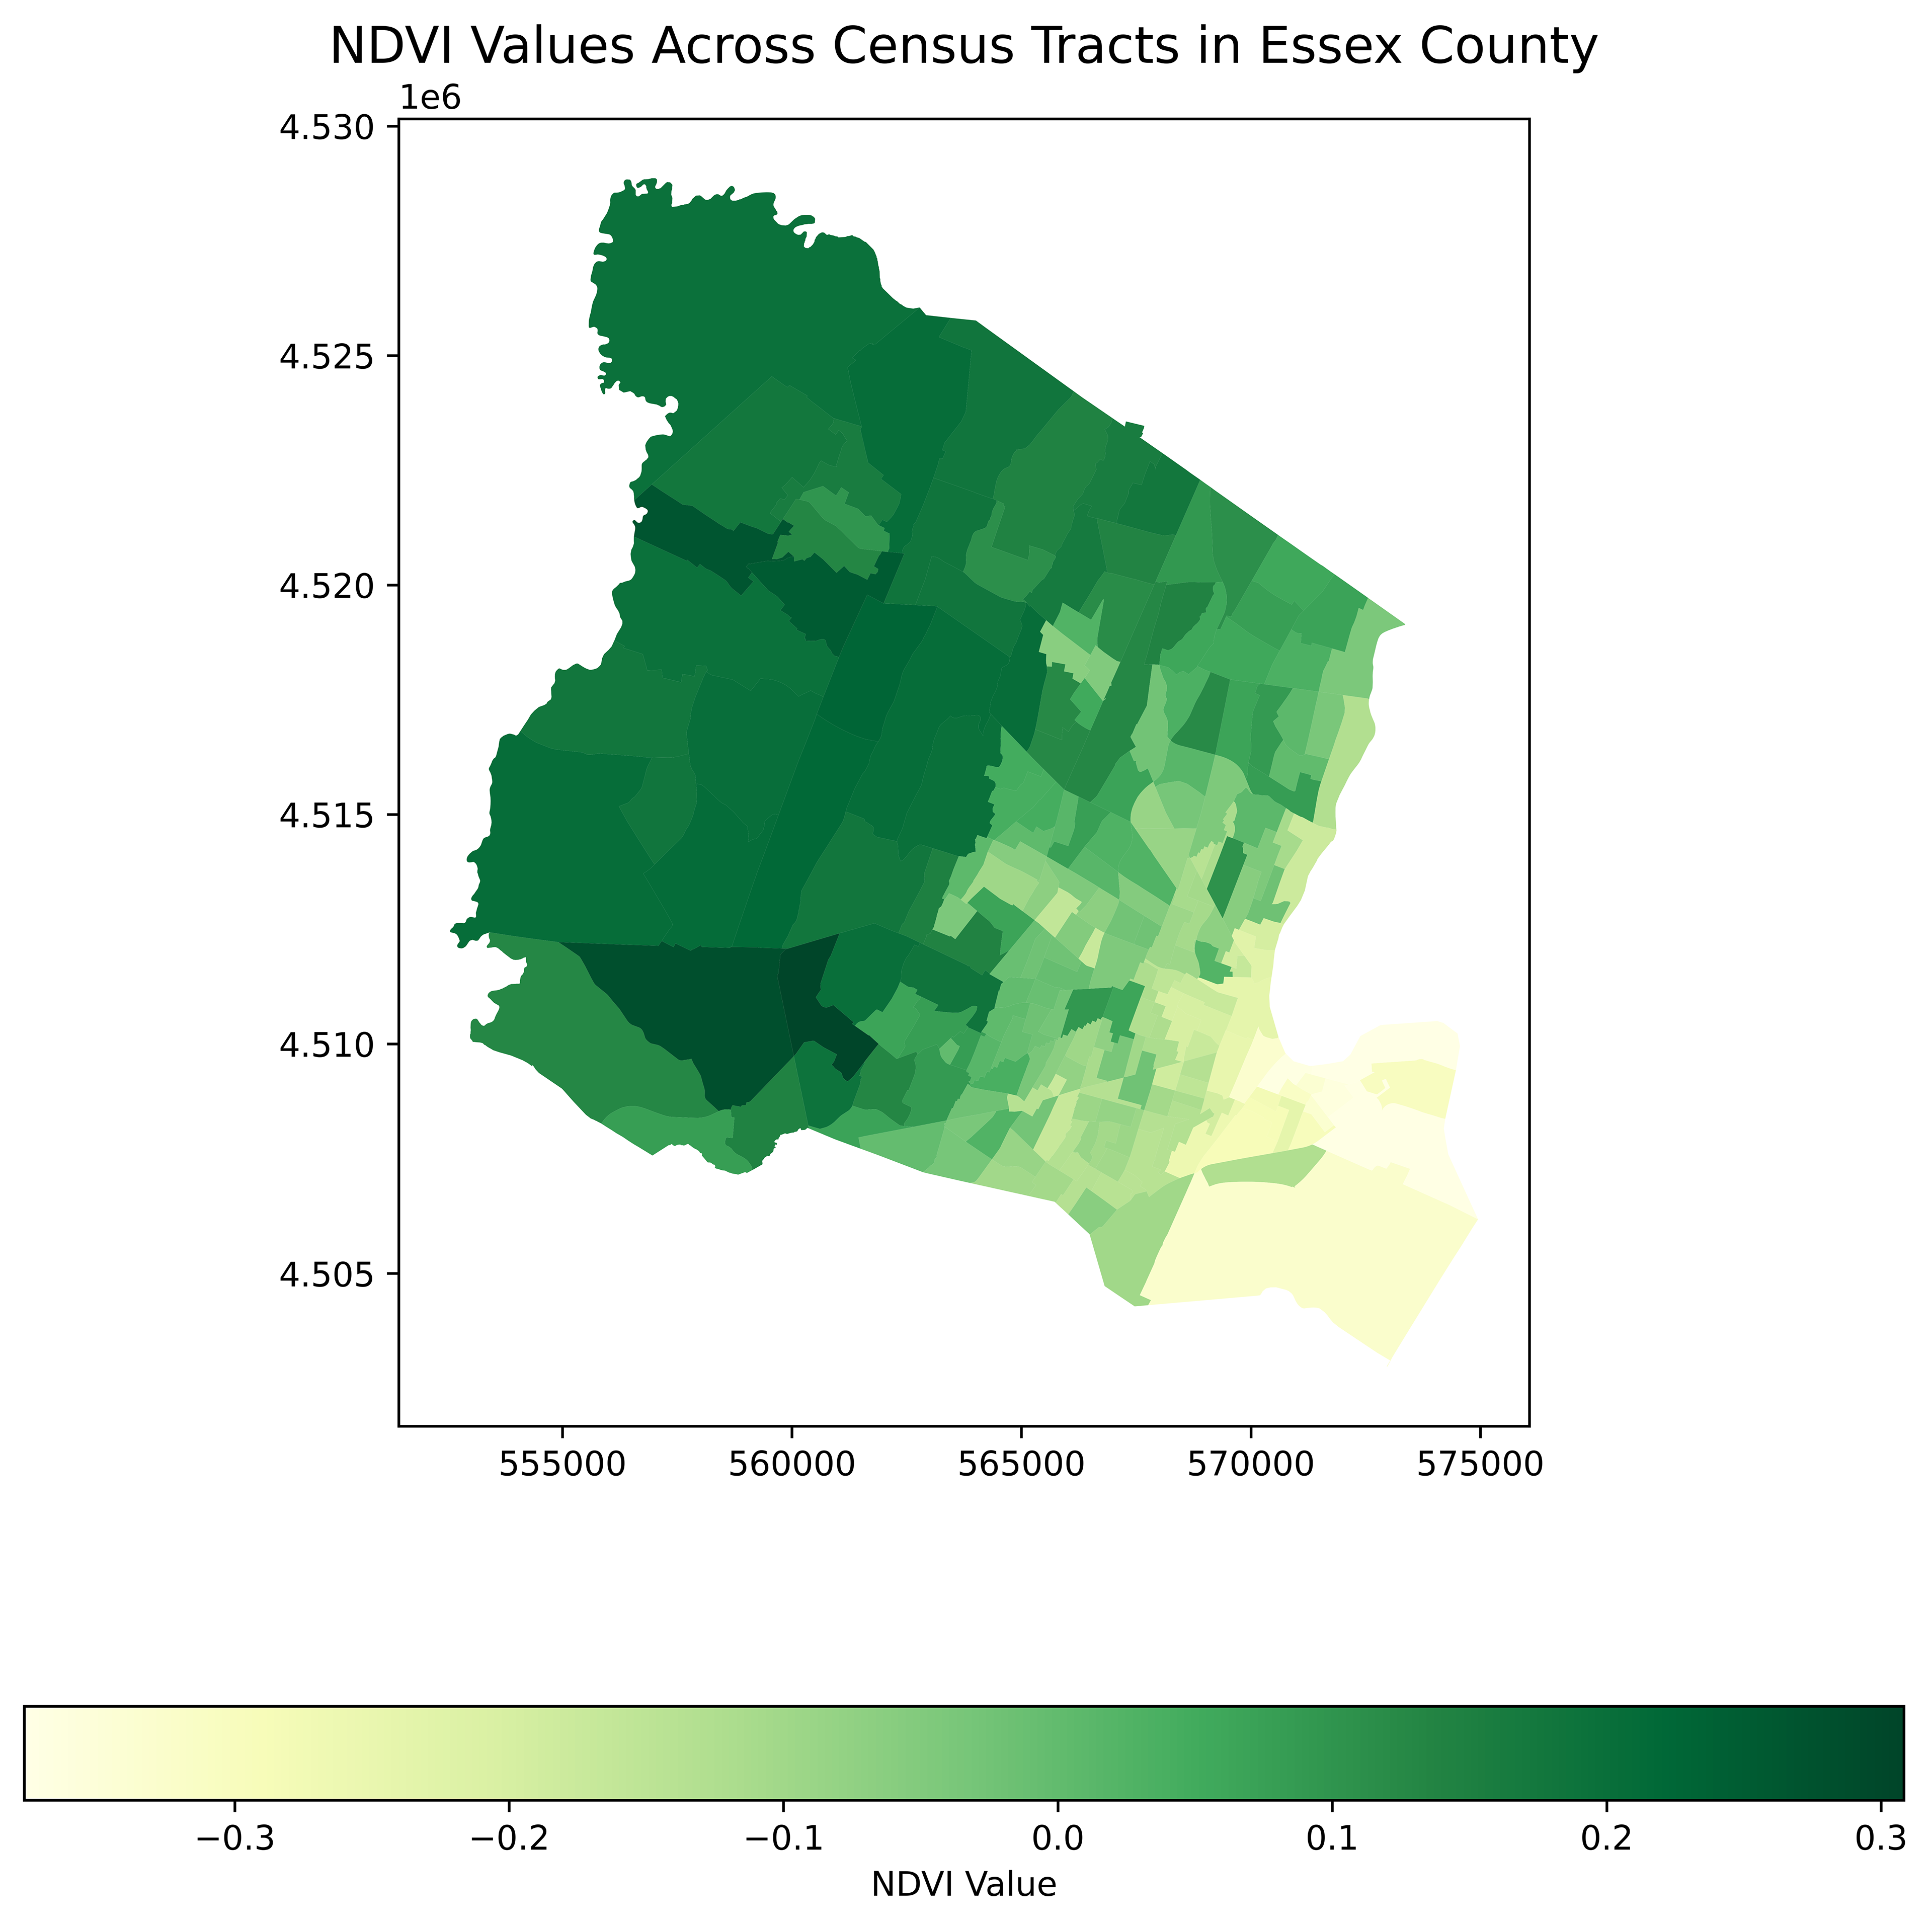
Our NDVI analysis for Essex County revealed distinct patterns of vegetation cover. Urbanized regions, characterized by dense infrastructure and limited green spaces, showed lower NDVI values. Conversely, areas such as parks, forests exhibited higher NDVI values, reflecting healthy vegetation cover.
The map below illustrates the spatial distribution of NDVI values across Essex County's census tracts. Darker green areas indicate regions with higher NDVI values, highlighting zones with denser and healthier vegetation. In contrast, lighter areas reflect urban centers or regions with sparse vegetation.
The visualization provides valuable insights for urban planners and environmentalists, offering a clear picture of where vegetation is thriving and where it may need more attention.