Analyzing Bachelor's Degrees Across Disciplines: A Spatial Study of Philadelphia County
Introduction
In this blog post, we dive into a geospatial analysis of educational attainment across different disciplines in Philadelphia County, Pennsylvania. The goal is to understand the distribution of bachelor's degrees in fields such as Computer Science, Engineering, Social Sciences, and other degrees by using data from the U.S. Census Bureau and visualizing it through choropleth maps.
Data Collection: U.S. Census API
The analysis begins with gathering data from the U.S. Census Bureau's American Community Survey (ACS) via the Census API. This step involves fetching detailed statistics on educational attainment at the census tract and block group levels. We focus on variables that capture bachelor's degrees in specific fields, including:
B15012_002E: Computers, Mathematics, and Statistics
B15012_003E: Biological, Agricultural, and Environmental Sciences
B15012_004E: Physical and Related Sciences
B15012_005E: Psychology
B15012_006E: Social Sciences
B15012_007E: Engineering
B15012_008E: Multidisciplinary Studies
B15012_010E: Business
B15012_001E: Total male with insurance (used as the base for comparison)
The data is fetched specifically for Pennsylvania, as this state is the focus of the study.
Data Processing: Merging Spatial and Tabular Data
Once the census data is obtained, the next step is to merge it with spatial boundaries at the census tract level, using Geopandas. This allows us to link each educational variable to its corresponding geographic region in Philadelphia. The "GEOID" identifier, which combines state, county, and tract codes, is used to ensure a correct match.
Next, new columns are created to calculate the percentage of degree holders in each field, relative to the total population with a bachelor's degree. This results in columns such as:
Comp_Math_Statistics: Percentage of degree holders in Computers, Mathematics, and Statistics
Bio_Agri_Envi: Percentage in Biological, Agricultural, and Environmental Sciences
Social_Sciences: Percentage in Social Sciences, and so on.
Python Libraries used
Pandas: Handles tabular data, merging, and calculations.
Geopandas: Works with spatial data, merges shapefiles, and plots maps.
Census: Fetches data from the U.S. Census API.
US (states module): Retrieves state and county FIPS codes for census queries.
Matplotlib: Creates choropleth maps, color schemes, and saves visualizations.
Mapclassify: Classifies data into intervals for choropleth maps.
OS: Manages directories and file paths for saving data.
Matplotlib.colors: Customizes color maps, normalizes data, and converts colors to hex format.
Step-by-Step Analysis
1. Extracting Data for Philadelphia County
The study filters the dataset to focus exclusively on Philadelphia County (COUNTYFP = '101'). This step narrows down the analysis to a single geographic area of interest, ensuring that the visualization only includes data relevant to Philadelphia.
2. Creating Choropleth Maps
The most critical part of the analysis is creating choropleth maps. Choropleth maps visually represent data using color gradients. For this study, we use color to show the concentration of bachelor's degree holders in different fields across Philadelphia.
3. Customizing Color Schemes
The maps use a color scheme called YlOrRd (Yellow-Orange-Red) to show variations in the data, which is modified to include an additional color—grey. Grey is used to represent areas where no data is available, making the maps more informative.
Each choropleth map is generated using an Equal Interval classification scheme, dividing the data into four equal categories, which helps in comparing the degree distributions across different regions.
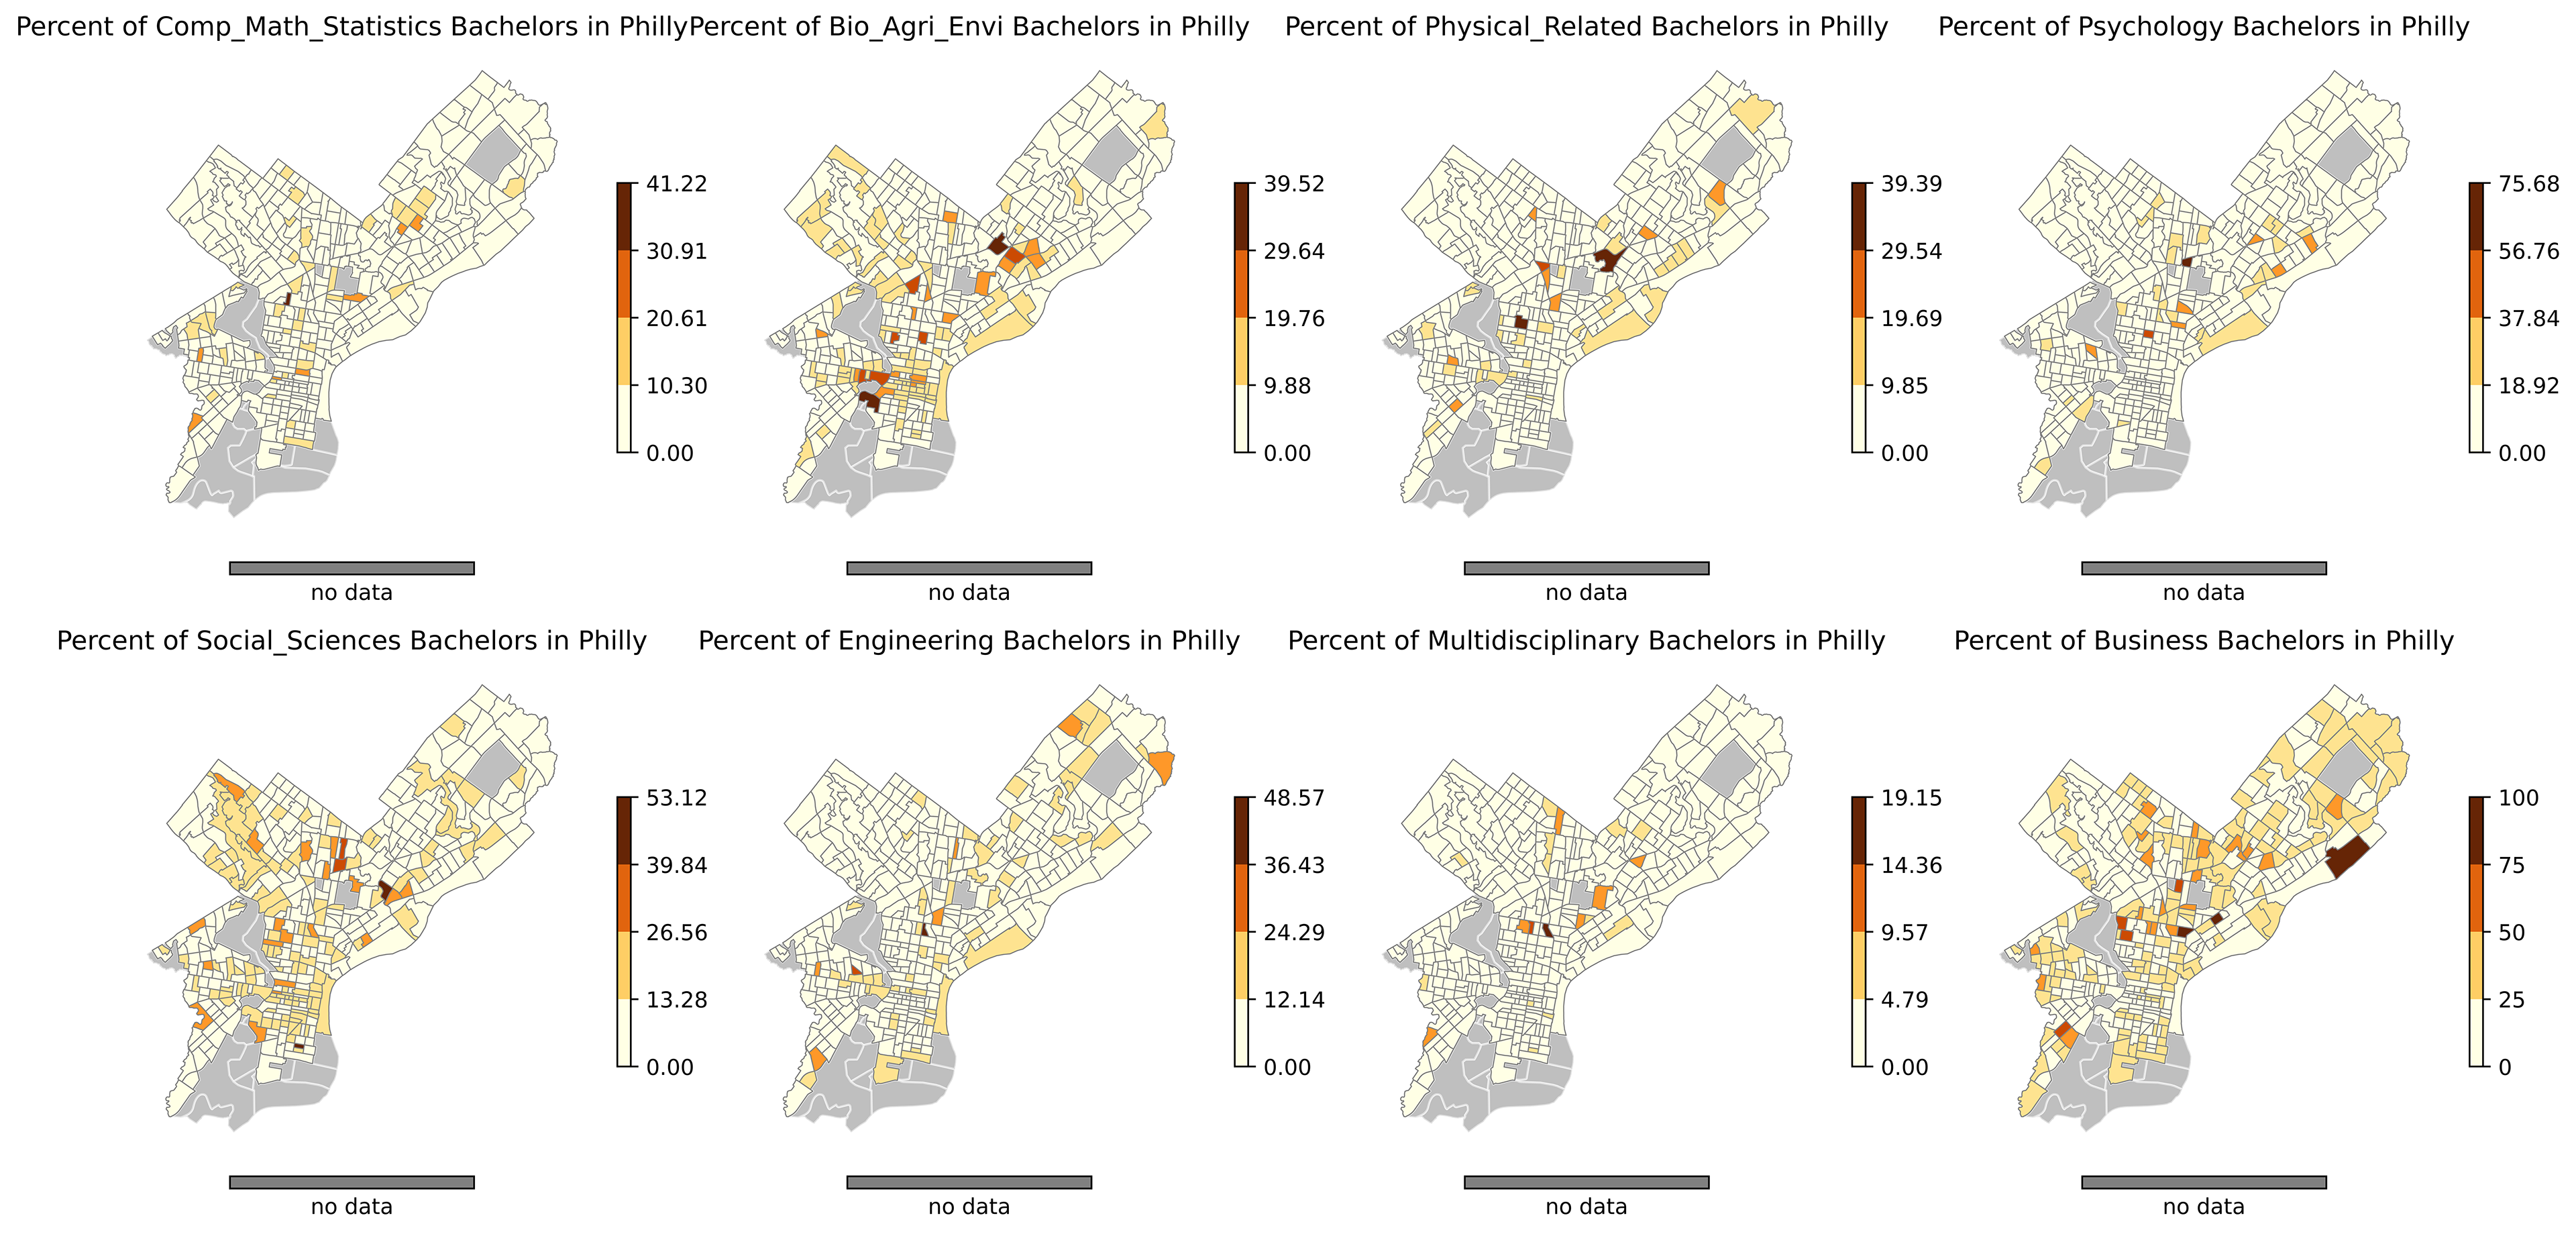
4. Visualizing Bachelor's Degrees in Different Fields
The analysis includes a set of maps that visualize the percentage of bachelor's degree holders in the following fields:
Computers, Mathematics, and Statistics
Biological, Agricultural, and Environmental Sciences
Physical and Related Sciences
Psychology
Social Sciences
Engineering
Multidisciplinary Studies
Business
These maps provide insights into where concentrations of degree holders in each field are located within Philadelphia.