Housing Units Distribution in Allegheny County: A Detailed Exploration USING Census API
Introduction
Understanding the housing landscape of a region can provide valuable insights into its socioeconomic status and living conditions. Recently, I embarked on a project to analyze the bedroom distribution in Allegheny County, Pennsylvania, using the US Census API and several powerful Python libraries. This post walks through my methodology and findings, offering a glimpse into how geospatial data analysis can reveal intricate patterns in housing data.
Setting Up the Environment
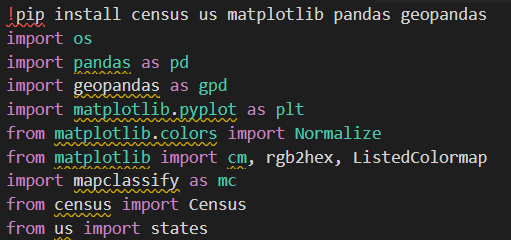
Before diving into the analysis, it was essential to set up the working environment by installing necessary libraries such as matplotlib, pandas, geopandas, mapclassify, census, and us.
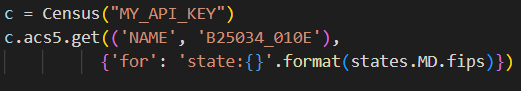
Setup API key
The call shown in the code will return the name of the geographic area and the number of homes that were built for the state of Maryland.By default, the year for a dataset is the most recent year available. To access earlier data, pass a year parameter to the API call
Datasets
For each dataset, the first year listed is the default.
acs5: ACS 5 Year Estimates (2022, 2021, 2020, 2019, 2018, 2017, 2016, 2015, 2014, 2013, 2012, 2011, 2010, 2009)
acs3: ACS 3 Year Estimates (2013, 2012)
acs1: ACS 1 Year Estimates (2022, 2021, 2019, 2018, 2017, 2016, 2015, 2014, 2013, 2012, 2011)
acs5dp: ACS 5 Year Estimates, Data Profiles (2022, 2021, 2019, 2018, 2017, 2016, 2015, 2014, 2013, 2012, 2011, 2010, 2009)
acs3dp: ACS 3 Year Estimates, Data Profiles (2013, 2012)
acs1dp: ACS 1 Year Estimates, Data Profiles (2022, 2021, 2019, 2018, 2017, 2016, 2015, 2014, 2013, 2012, 2011)
acs5st: ACS 5 Year Estimates, Subject Tables (2022, 2021, 2019, 2018, 2017, 2016, 2015, 2014, 2013, 2012, 2011, 2010, 2009)
sf1: Census Summary File 1 (2010)
pl: Redistricting Data Summary File (2020, 2010, 2000)
Retrieving and Preparing Data
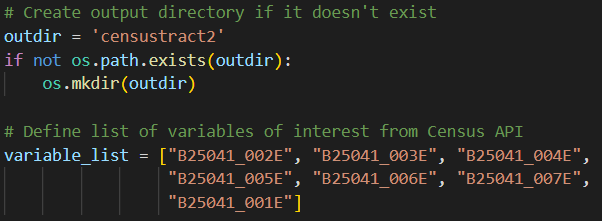
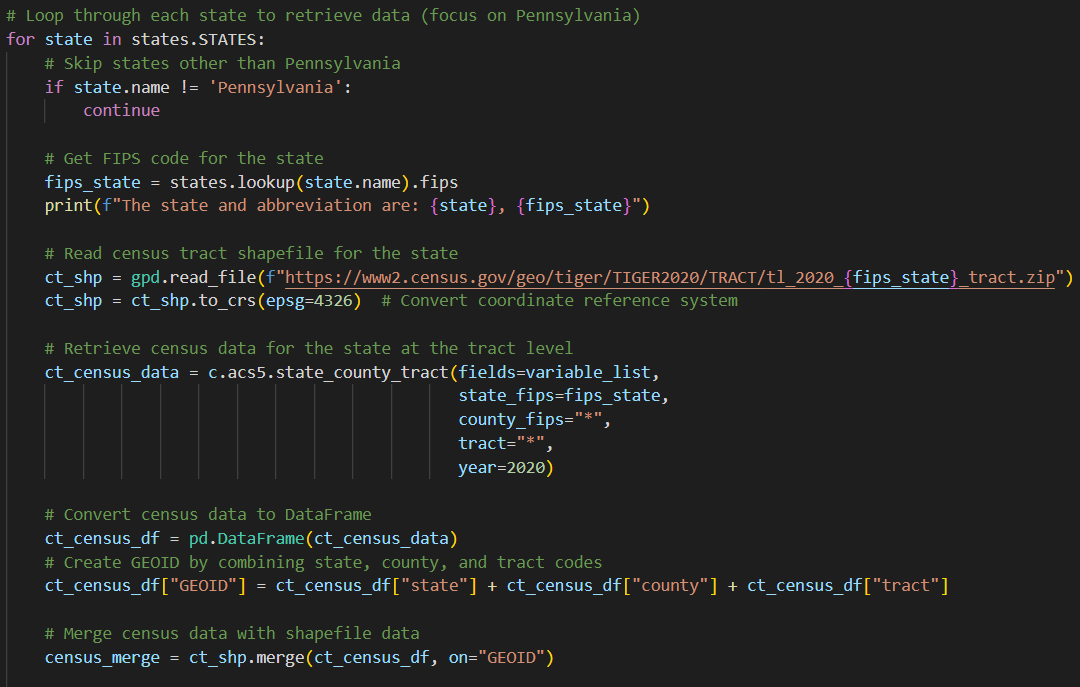
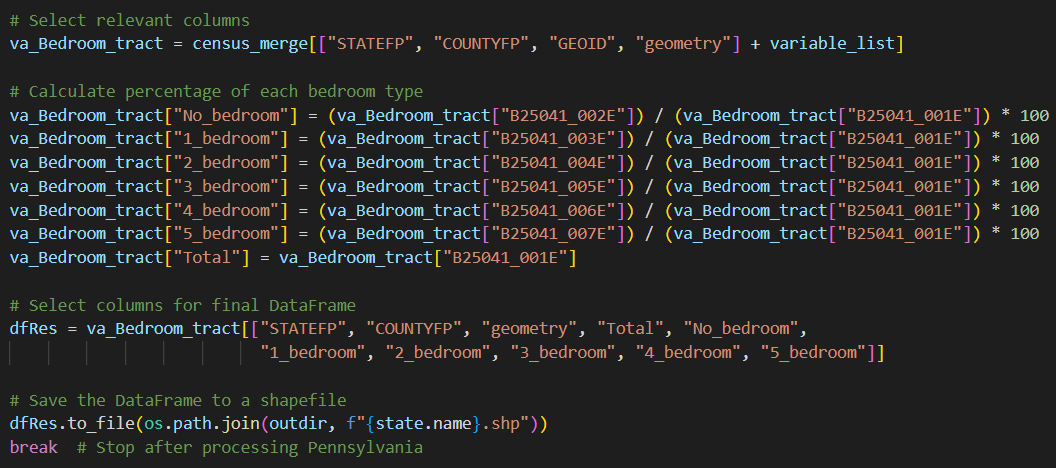
The first step was to define the variables of interest from the Census API, specifically the bedroom counts ranging from no bedrooms to five or more bedrooms. Using a loop, I retrieved the data for Pennsylvania and merged it with the corresponding census tract shapefiles.
Focusing on Allegheny County
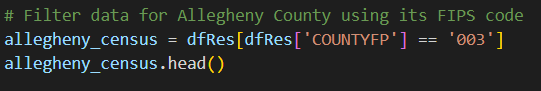
With the statewide data prepared, I focused on Allegheny County by filtering the dataset for the county’s specific FIPS code. This allowed for a more localized analysis.
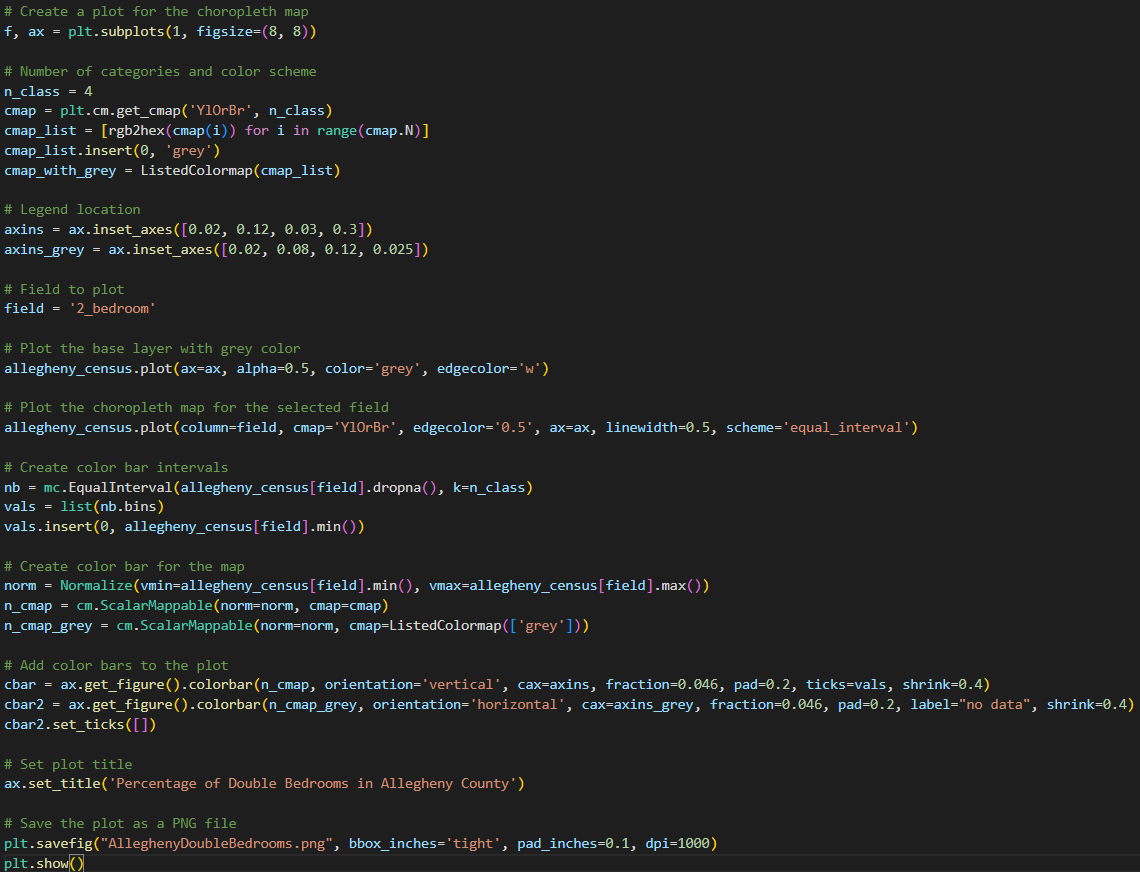
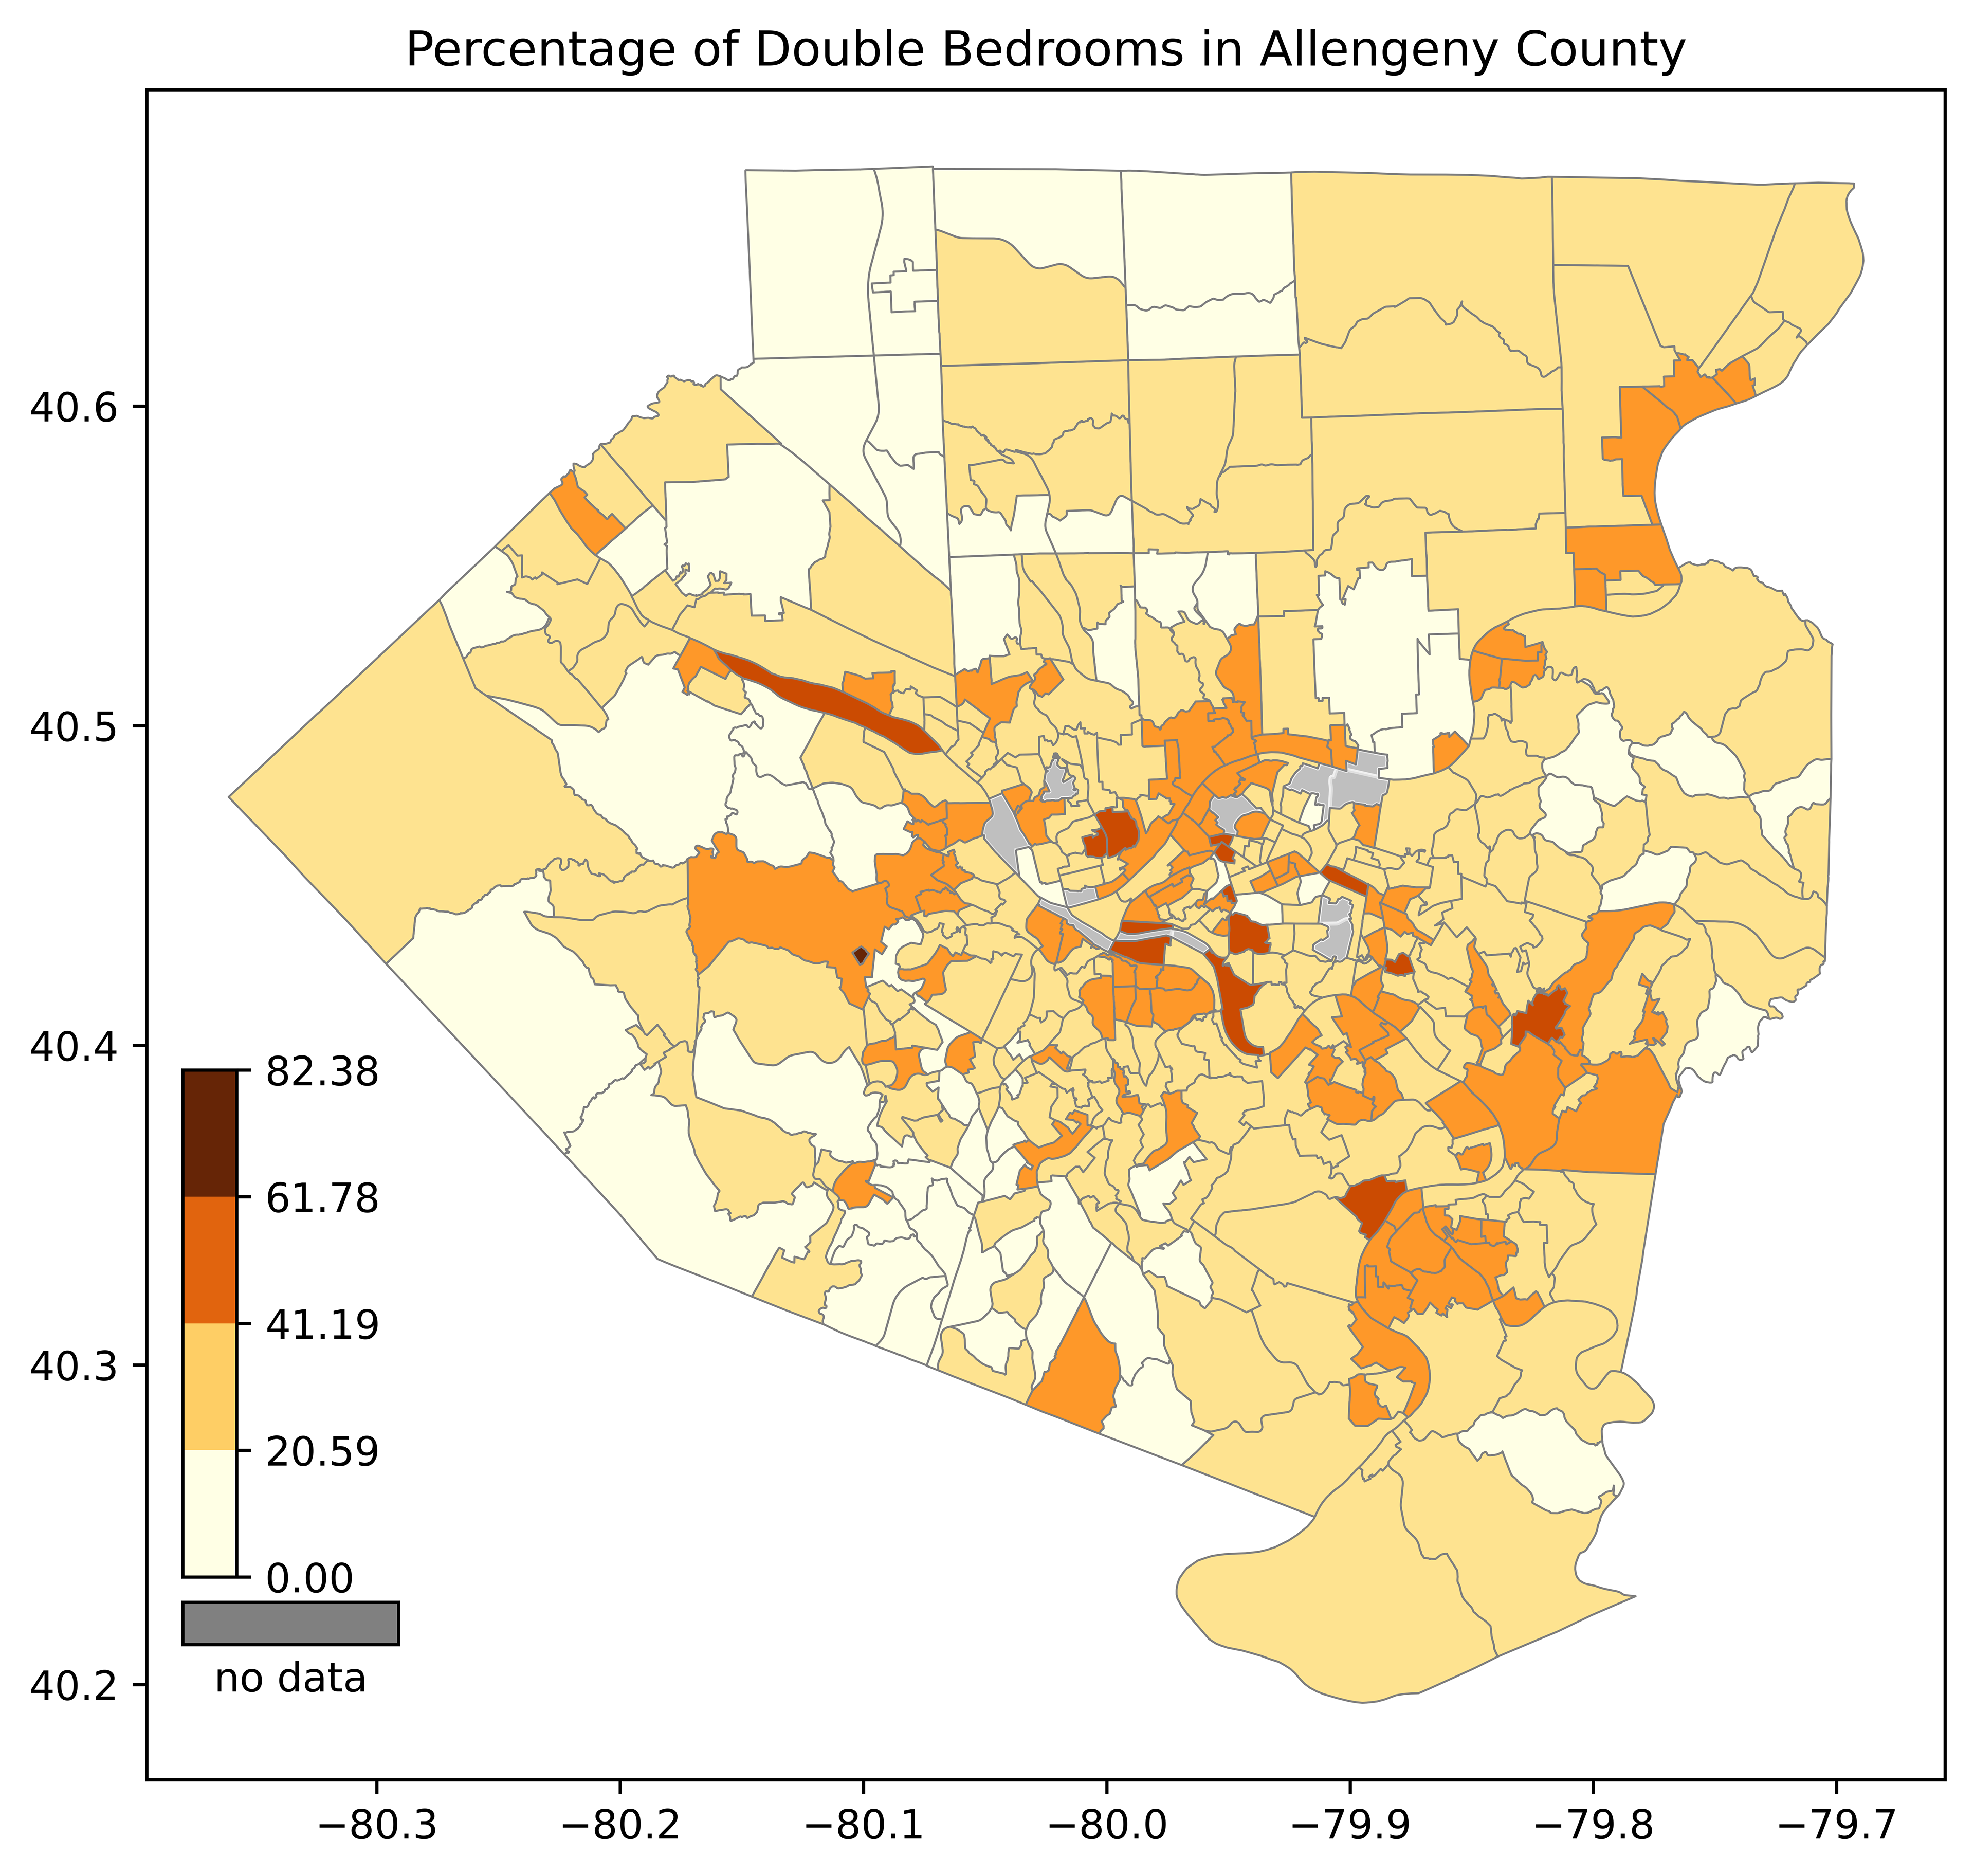
Visualizing the Data
The final step involved visualizing the percentage of bedrooms across Allegheny County using a choropleth map. For this analysis, I specifically focused on the percentage of two-bedroom units to test the methodology and visualize the distribution. This map highlights different tracts with varying shades, offering a clear visual representation of the data.