Traffic accidents across Philadelphia from 2007 to 2017
INTRODUCTION
In today's data-driven world, the ability to visualize complex datasets in an intuitive and interactive manner is crucial for understanding and solving real-world problems. This project leverages the power of GIS to create an interactive map showcasing motor vehicle collisions in Philadelphia for the year 2017. By utilizing modern web technologies like Mapbox GL JS, the map provides users with a dynamic and engaging tool to explore traffic collision data across the city. The interactive map allows users to filter collision data by time of day and day of the week, providing a deeper understanding of the temporal patterns associated with traffic accidents.
EXPLORATION
The dataset underwent a thorough quality check and initial exploration to understand the underlying patterns. This involved grouping the traffic collision data by year, month, and week to generate graphs that reveal trends over time.
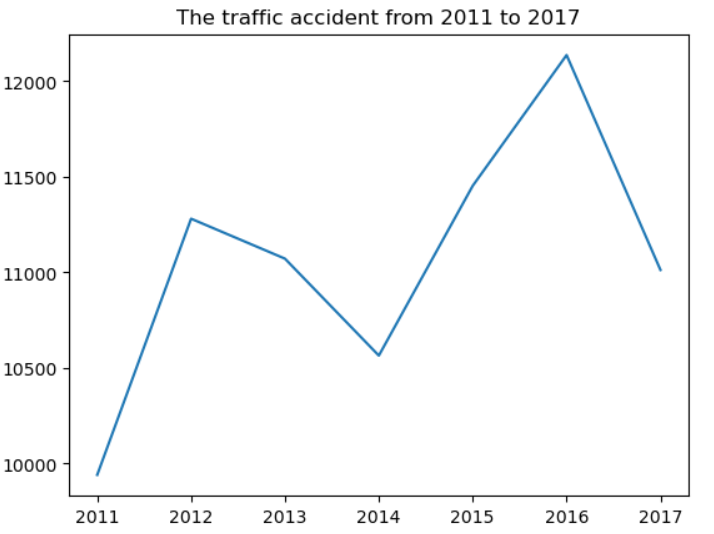
Accidents from 2011 to 2017
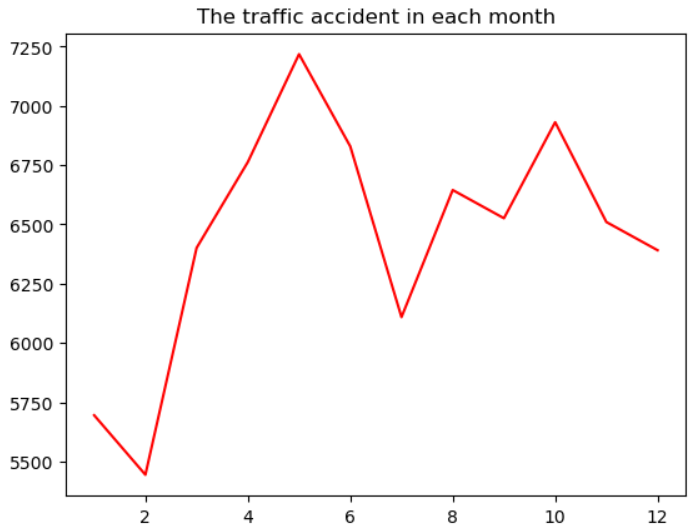
Accidents in each month
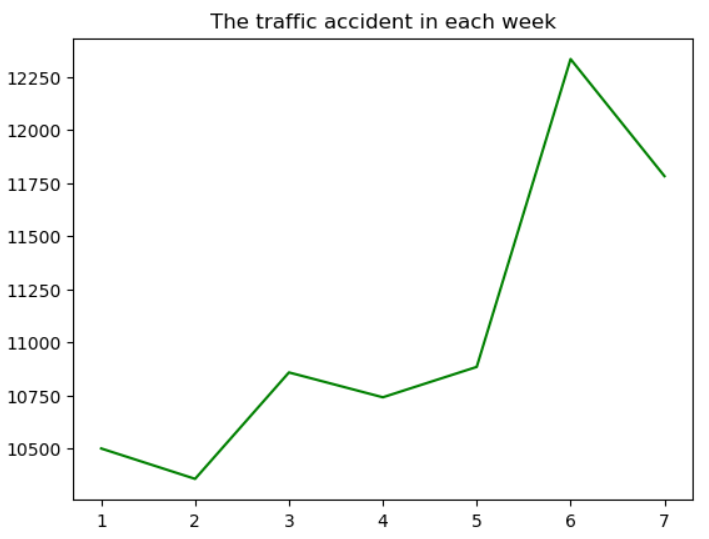
Accidents in each week
GEOCODING
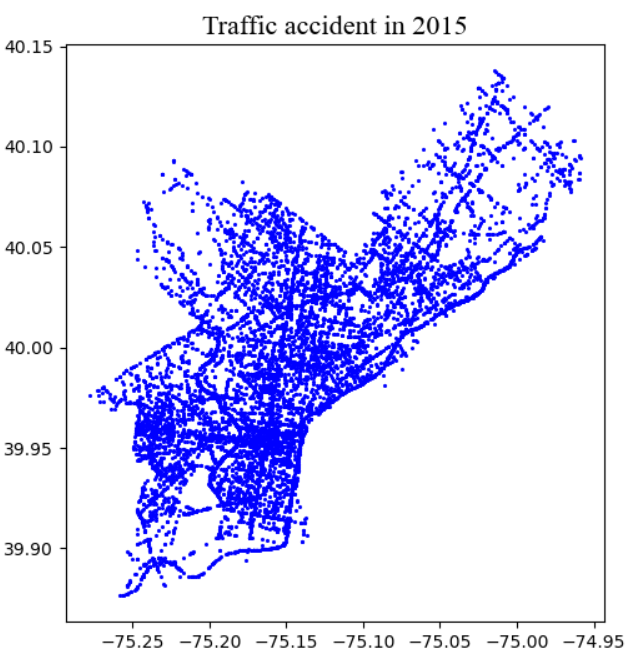
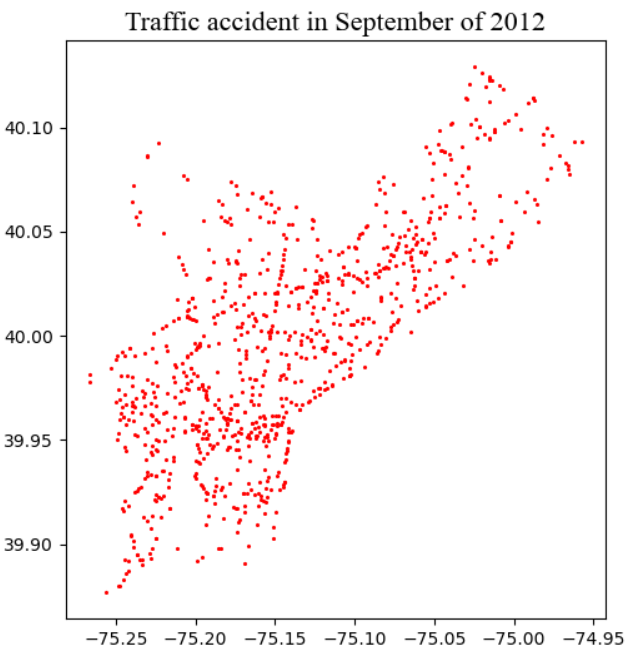
The analysis begins with a dataset of traffic collisions available in CSV format, containing essential information such as the date, location, and severity of accidents. Before diving into spatial analysis, the data underwent a crucial cleaning and preparation phase. This stage involved geocoding the data to accurately map each traffic incident to the Philadelphia region. Following this preparation, the cleaned and geocoded data was then read into a GeoDataFrame, where it could be effectively analyzed and visualized using tools designed for spatial data.
REPROJECTION
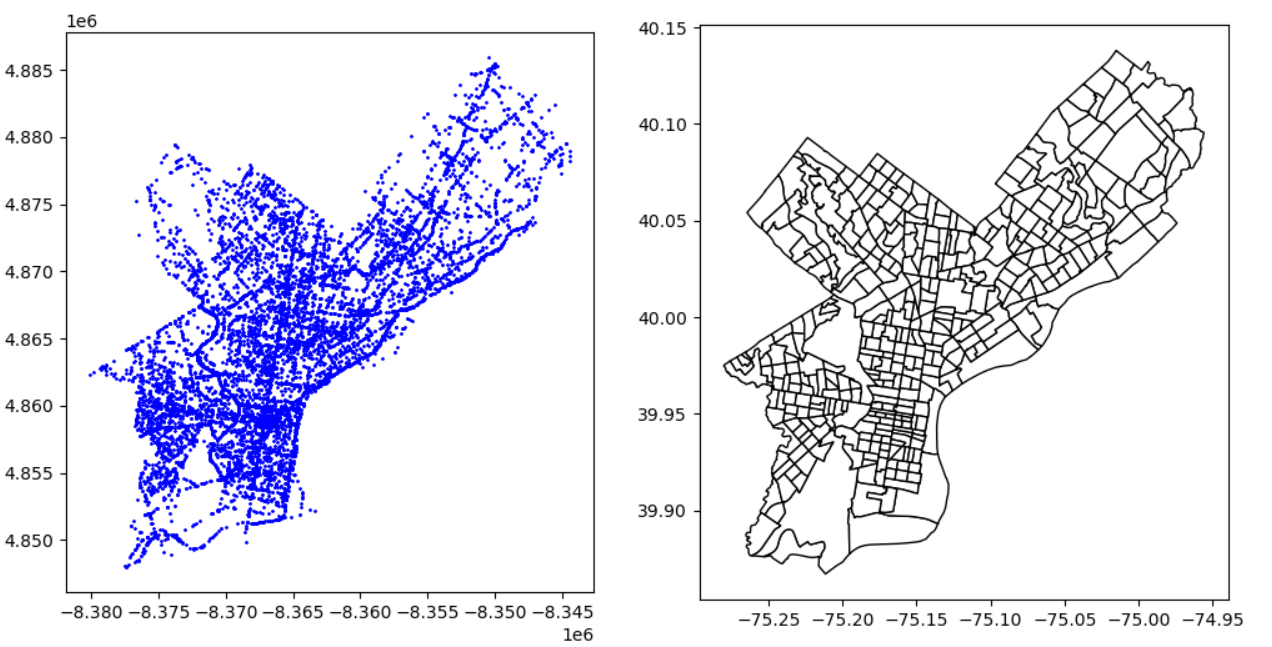
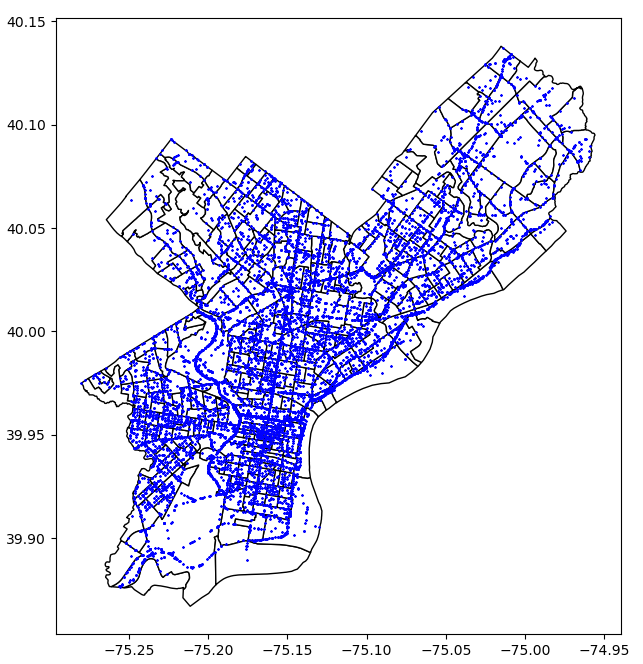
A side-by-side comparison of the census map and the accident data. This dual-panel plot allows for a more nuanced examination, where one panel displays the base census map, while the other panel overlays the accident data onto the same map. To ensure that the spatial data is accurately aligned, a final step involves reprojecting the accident data to match the coordinate reference system (CRS) of the census map. This reprojection is crucial for maintaining spatial accuracy, as the CRS used for the accident data may differ from that of the census map. By converting the accident data to the appropriate CRS (EPSG:4269), the two datasets are correctly aligned, ensuring that the overlay accurately reflects the geographic relationships.
GEOVISUALISATION
Finally, created a visually engaging and interactive map that showcases motor vehicle collisions in Philadelphia for the year 2017. The map is built using Mapbox GL JS, a powerful mapping library that allows for dynamic, real-time interaction with geospatial data.

This interactive map serves as a powerful tool for visualizing and analyzing motor vehicle collisions in Philadelphia. By allowing users to explore data through different time frames and day filters, it provides valuable insights into when and where traffic accidents are most prevalent. Whether it's identifying high-risk hours or comparing weekday versus weekend collision patterns, the map's interactive features make it a dynamic resource for city planners, traffic analysts, and concerned citizens alike.
The clean design, intuitive controls, and real-time responsiveness make this map not just a functional tool but also a visually appealing and user-friendly platform for exploring critical traffic safety data. Through this map, users can uncover patterns, make data-driven decisions.